CMD-Chart

Tiny animated, colourful, dependency-free histogram charting library for command line, written in and for nodejs.
Chart types
For now, the only type of chart supported are histograms, as this is what I was working with when I got distracted.
In the future, I may add other types. Open an issue if you'd like another particular type supported. If I don't find the time to get around to it, pull requests are always open.
Documentation
Importing
const CMDChart = Plotting
If you'd like to follow along with some data, copy and paste the following array in your code. This is the data I use in all examples.
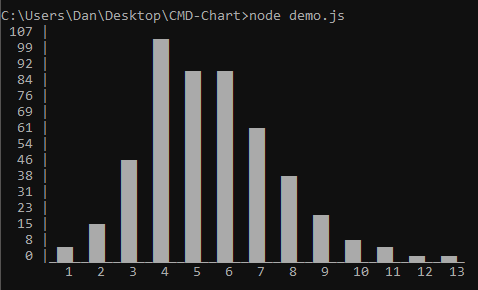
const data = 1 1 1 1 1 1 2 2 2 2 2 2 2 2 2 2 2 2 2 2 2 2 3 3 3 3 3 3 3 3 3 3 3 3 3 3 3 3 3 3 3 3 3 3 3 3 3 3 3 3 3 3 3 3 3 3 3 3 3 3 3 3 3 3 3 3 3 3 3 3 3 4 4 4 4 4 4 4 4 4 4 4 4 4 4 4 4 4 4 4 4 4 4 4 4 4 4 4 4 4 4 4 4 4 4 4 4 4 4 4 4 4 4 4 4 4 4 4 4 4 4 4 4 4 4 4 4 4 4 4 4 4 4 4 4 4 4 4 4 4 4 4 4 4 4 4 4 4 4 4 4 4 4 4 4 4 4 4 4 4 4 4 4 4 4 4 4 4 4 4 4 4 4 4 4 4 4 4 5 5 5 5 5 5 5 5 5 5 5 5 5 5 5 5 5 5 5 5 5 5 5 5 5 5 5 5 5 5 5 5 5 5 5 5 5 5 5 5 5 5 5 5 5 5 5 5 5 5 5 5 5 5 5 5 5 5 5 5 5 5 5 5 5 5 5 5 5 5 5 5 5 5 5 5 5 5 5 5 5 5 5 5 5 5 5 5 5 5 5 5 6 6 6 6 6 6 6 6 6 6 6 6 6 6 6 6 6 6 6 6 6 6 6 6 6 6 6 6 6 6 6 6 6 6 6 6 6 6 6 6 6 6 6 6 6 6 6 6 6 6 6 6 6 6 6 6 6 6 6 6 6 6 6 6 6 6 6 6 6 6 6 6 6 6 6 6 6 6 6 6 6 6 6 6 6 6 6 6 6 6 7 7 7 7 7 7 7 7 7 7 7 7 7 7 7 7 7 7 7 7 7 7 7 7 7 7 7 7 7 7 7 7 7 7 7 7 7 7 7 7 7 7 7 7 7 7 7 7 7 7 7 7 7 7 7 7 7 7 7 7 7 7 8 8 8 8 8 8 8 8 8 8 8 8 8 8 8 8 8 8 8 8 8 8 8 8 8 8 8 8 8 8 8 8 8 8 8 8 8 8 8 9 9 9 9 9 9 9 9 9 9 9 9 9 9 9 9 9 9 9 9 9 10 10 10 10 10 10 10 10 10 10 11 11 11 11 11 12 12 13 14The basic API structure is as follows:
CMDChart.plot(data, options)
array data - The data array
object options - An optional configuration object
Returns - When given an animation duration, this returns a promise.
This does the plotting
CMDChart.refresh(data, options)
array data - The data array
object options - An optional configuration object
Returns - When given an animation duration, this returns a promise.
This refreshes an existing chart with new data, and new styles. If an animation duration is given, the animation will play again.
CMDChart.clear() | CMDChart.clear(lines)
integer lines - When given no parameters, it clears the existing chart. When given a positive integer, it will clear that many lines from the console. This may be useful to remove any lines that were logged out after the chart, if you wish to clear it.
It's important that no other things are logged to the console, during animation. Again, if you log anything out before clearing the chart, you can use CMDChart.clear(lines) to remove those lines first.
The simplest, no configurations example is the following:
CMDChartThis will plot out the following:
The available configurations are as follows:
title
string - An optional heading for the chart. Will be roughly in the middle
default - none
rows
positive integer - You can set the height of the bars with this. The axis and chart will scale accordingly. This does not include the title line, if a title is given, or the x axis
default - 15
animation
positive integer - The number of milliseconds to perform the rendering animation for
default - 0
colours
object - Another configuration object, with for colour options
default - white foreground, black background
The colour options are as follows, for both foreground, as well as background:
- Black
- Red
- Green
- Yellow
- Blue
- Magenta
- Cyan
- White
And the following are items which can be styled:
| Attribute | What it is |
|---|---|
| bars | The actual bars on the chart |
| chartBackground | The background behind the bars, only |
| keys | The values along the axis |
| axis | The vertical and horizontal axis lines |
| title | The title |
For example, if you wanted to plot the above data, at a height of 10, with green bars and keys, white background, and red axis, with a title of "Hello World", and you wanted the animation to take one second, you will need the following:
CMDChart
And, if you want to wait for the chart to finish its rendering animation, before you do anything else, you can await its returned promise, like so:
CMDChart